I know Google is traditionally very stingy when it comes to adding elements to their interfaces, but this seems important enough to dedicate at least a small portion of screen real estate to it on every YouTube video page. It would certainly have more of an impact than a report that 99% of users will never see.
It doesn't have to be a big deal - maybe just a "cellphone bars"-like icon, linked to further info and net neutrality content.
They are doing it. If you have a slow connection and the video start to buffer a lot, there is a banner that appear right under the video linking to the video quality report. I saw it yesterday
Good. We need to Name-n-Shame these ISP's into doing good by their customers.
There was an interesting interview with Comcast CEO the other day where he said, "[We] don’t wake up everyday and go to work and say we want to be hated.”
But then he attempted to shift the blame to content providers:
"Roberts followed up this statement by saying that Comcast is mostly hated because 'it’s the company consumers have to deal with when other companies raise their prices.'"
They generally offer better pricing for faster speeds with less BS, ie no monitoring, ad injections, throttling, etc.
You will have to look for ones in your area, but they are there. Usually each major city will have a few. Rural areas will tend to have more WISP's (wireless isp's) that are also small and all about their customers.
The recourse is to call your Senator and Congressman and demand they force big ISP's to lease fiber/copper to smaller companies, much like phone-line providers are required to lease their copper to other companies. This will help spur competition, which means everyone wins.
I don't know what you mean by "major city," but I look in Milwaukee every six months or so. There simply aren't any "independent ISPs" here with remotely comparable speeds or prices.
Hi! I'm one of the four (that I know of) independent ISPs that serve Milwaukee and the surrounding areas with a combination of WISP, Fiber, and Copper technologies. We all suck at advertising and rely on referrals.
In the Milwaukee market we all focus on business users (and generally ones that need symmetric or high-upload service and would be looking at a fiber build) or MDU applications because... For the past several years we've seen a consumer preference for absolute lowest cost over quality or available bandwidth. At the extreme end we still have users on wholesaled ILEC DSL on provisioned for 768k download that just don't care enough to upgrade or switch because they like the sub $20 price. It's ILEC controlled so I can't just upgrade them out of the goodness of my heart either.
The participants list for our little Internet Exchange is somewhat workable as a directory of area independent ISPs although some of us are datacenter operators or as far away as Racine or Madison: http://www.mkeix.net/
This is my experience as well, just across the pond from you (West Michigan).
Home users demand the world for $19.99 a month and no contract. Therefore, they get terrible Comcast / TWC / ATT (essentially, they get what they asked for).
There are a lot of people trying to run the "independent ISP" gauntlet, all over the US. (And I'm biased, as I am one of them). But those consumer prices usually only work if you offer bad/slow service, have a complete monopoly, or have government subsidy.
Since most Independents don't have or won't do most of those, they have to focus on business, as those are (usually) the only people who care enough to put actual money into service.
I haven't been in the access game for a long time, but I honestly don't know how you could sell to even smart "prosumers" these days.
I would love to get a ~50mbps line to my home, from a reliable local ISP with clue. I'd pay around $150/mo for such service, and I'm not one of those guys that runs stuff maxed out 24x7.
There just are no options where I live for that amount of bandwidth other than Comcast. So instead I have my primary comcast line ($120/mo) which is 150/20, and a backup DSL line from USWest/Qwest/Centurylink/whatever they are calling themselves today. I believe that one is 20/2, but it sucks so bad (seriously no 1500 MTU still? sigh.) I rarely use it even for failover anymore. LTE is faster.
There are a two main reasons that I see, technical and business.
Generally speaking, multipoint access technologies (including cell & fixed wireless/wimax, DOCSIS, and multi-user fiber such as GPON) have a fixed amount of spectrum/timeslots to allocate for transfers. Transfer timeslots are allocated primarily for downlink (I use 75% down) because the vast majority of user traffic is download so it just makes sense to allocate that way.
On the business side it is one way to segment your customer base between business/pro users and residential users because residential users don't care and businesses are less price-sensitive. When they need more upload they are often willing to pay for dedicated symmetric connections such as TDM circuits or ethernet over fiber (the industry term is "Active Ethernet"). In theory these circuits cost more to provide because the last mile isn't shared with other users.
"Results from your location are not yet available." from the UK.
[Ranty aside:] Also the page is horrible. Got to the bottom, tried to scroll up using scrollbars, bars are gone. Attempted to use PgUp, doesn't work. Can't tell where in the page you are, sometimes it takes a few scroll "clicks" to move the page on, mostly just 1, but you can't tell if it's not moved because you're at the end or because it stalled or something.
Used the arrow keys, got to top and hovered over the "your results" and got the message above, tried to copy and paste but it's not accessible. Grrr, shouldn't have to use Inspect Element just to copy error text from a page.
Bet they employ a ton of people to focus solely on usability and accessibility of their pages too ...
I imagine ISPs will start using these results in advertising really quickly. "Google rates us as Excellent for video playback. Compare us with your ISP! We're faster than 82% of ISPs in this area."
Google/YouTube speed ratings could very quickly end up being analogous to school rankings. You want to be in an area with good schools, and if you don't have good schools you're probably going to start putting pressure on people to improve things.
In the Boston area, one ISP already does this (for Netflix, at least). Not only do I get flyers in the mail, but they also advertise online[1]; though that page has been updated to highlight some new feature with TiVo boxes, it used to specifically mention RCN being the fastest ISP in and around Boston for Netflix. The page still does say "RCN is Optimized for Netflix: RCN is directly connected to Netflix, providing the best possible Netflix experience, including a better picture and faster start up times."
Actually a major ISP in France (Free.fr) is throttling Youtube, on purpose, because they believe Google should pay them for the bandwidth but Google disagree.
An easy fix is using a VPN, because then the traffic is no longer recognized as Youtube by the ISP.
The (pending) merger of Comcast and Time Warner does not change any areas from a choice of Comcast or Time Warner to no choice, because there are no areas where the two cable providers cover the same addresses.
Lack of competition and transparency in the last mile is the essential problem, but the Comcast/Time Warner merger doesn't really change the status quo there (unless someone makes a significant change a condition of the merger). The blueprint of a solution is the pre-2005 regulation of DSL by ILECs: make cable providers (or at least comcast), ILECs, and anyone else with a natural monopoly offer line-sharing on reasonable terms, and watch ISPs spring up (or re-emerge) with competitive offers and better routing than the incumbents. Bonus points if wholesale pricing is required to be at least as low as retail pricing, unlike in the DSL times.
If it becomes clear that areas served by a single ISP get worse performance than those in areas with choices, than that too is useful to know and promote, right?
Or maybe Google just wants to publish charts showing Google Fibre areas are consistently at the top of their lists so that other municipalities will want to make it easy for them to enter their local market (and/or ask their local monopolies why they can't be more like a Google-town).
"I don't know, my ISP requires me to buy the video sites package in order to show video on YouTube ... but the good news is, it would give me access to Hulu, Amazon Instant, and Daily Motion too!"
Provo, UT, is interesting. It has both Google Fiber and Comcast. Their performance is essentially the same, with perhaps a very slight edge to Comcast. I tried to compare them in the other Google Fiber cities, but Provo was the only one I saw both Google and Comcast in. (Austin, TX, is interesting, because that is supposedly a Google Fiber city, but Google Fiber does not show up in the report).
Comcast has similar performance in all the cities I've lived in as an adult (Los Angeles area, Silicon Valley, Seattle, small towns on the west side of Puget Sound). Certainly not what I expected given all the complaining I see on the net about Comcast and YouTube performance.
> Certainly not what I expected given all the complaining I see on the net about Comcast and YouTube performance
Comcast gives many things about which to complain, but I've never had an issue with Youtube on them. What I've been shocked by in the past is the disparity between youtube on my comcast connection and youtube on people's TimeWarner connection when I've visited, where it has been completely abysmal in the past. Like, 1990s RealPlayer quality, not only because you have to turn it down to 144p just to play, but also because it still stutters horribly even at that resolution.
I feel like most of the "one weird DNS trick to fix youtube" posts have been about timewarner, though I don't know if my memory is accurate there.
Notably TimeWarner looks fine on these graphs (at least in a few places where I've had friends complain about it in the past), so maybe they've fixed things.
Oddly my wife used to see this on her laptop in our apartment in Los Angeles. I would play a video, and it would be fine at HD. I'd ping her the link, and she would attempt to play it and it would be stuttery and crappy. I'm not sure what changed, but eventually it just cleared up. We were on the same connection. Very odd.
I believe so. She probably wouldn't know how to change her DNS settings, and I don't think I would have changed either hers or my own from the default. I do recall turning off my ISP's auto-redirect on bad DNS spam. (It would try to suggest sites they got money from if I entered a website that didn't exist, for example.) But beyond that, I don't think we did anything to change DNS.
It's likely we were using the same browser. I'm not sure about Flash Player versions. Even if we weren't, why should that matter? I doubt we were too far off in the version numbers we used. Does YouTube do some sort of caching of info about what version of Flash you're using?
I have had serious issues with Hulu, YouTube, and Netflix with Comcast in the past (about a year ago most recently). After a year with a spotty WISP, I'm on Comcast again, and the performance seems to be better now.
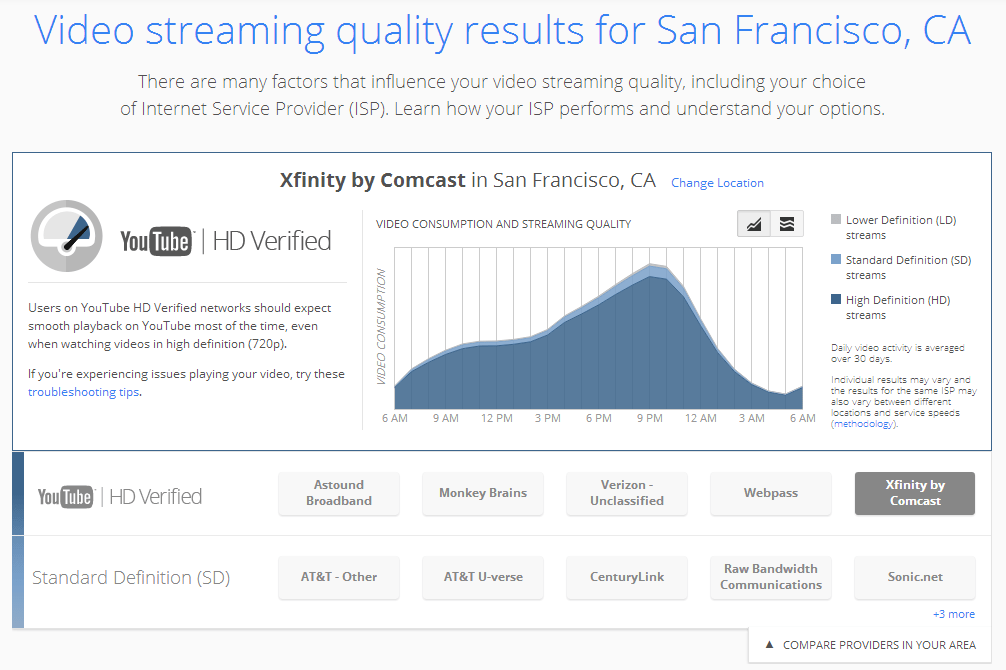
The graph shows what I assume is overall volume of bandwidth seen from that provider, and then the proportion of each type of YouTube stream the connection is capable of holding: HD, SD, or sub-SD. Seeing HD (dark blue) take up most of the volume is good, since it means the ISP provides enough bandwidth throughout the day to watch a video in high def.
This is just flawed. It will put your provider that tends to sell 3mbps DSL lines that are rock-solid 24/7 with great peering below that of providers that sell 50Mbps lines that have fairly crappy peering and you only get 4Mbps and 5% packet loss during peak.
Or at least it will look that way on these graphs, since very few HD streams will be performed by the first provider's customers.
I'd be a heck of a lot more interested in looking at data that shows buffer underruns based on time of day. That will show congested providers vs. providers that simply offer less bandwidth. AKA it will separate the providers that lie, and those that are honest.
I don't know much about youtube's architecture, but in general these stats are pretty simple to do via basic math and access logging. You look at the total request time, how many bytes were sent, video bitrate, and then calculate how many seconds of video were actually downloaded vs. how long the request took. If the request took longer than the total seconds of video downloaded, then the user probably experienced buffering. It's a bit rough, but the numbers are incredibly useful in aggregate. I've used this method to identify peering issues (looking at you FT) when more advanced methods are not available.
Can anyone explain what these numbers really mean? How can they possiby be so low?
The only thing I can imagine is that it measures sum(max(clientSpeed,NetflixSpeed))/n , where NetflixSpeed is only about 4Mbps. That would make this a ranking of what isp has the lowest amount of users with really shitty WiFi, or users watching netflix on slow smartphones. I doubt there are many ISP's with offer a connection of less than 4Mbps between their backbone and Netflix.
Either way, it's good to see my ISP ranking the second highest worldwide.
> Can anyone explain what these numbers really mean? How can they possiby be so low?
If you click on any details page (either the global chart or country full results) and scroll to the page bottom you get an explanatory text:
> These ratings reflect the average performance of all Netflix streams on each ISPs network from Nov. 2012 through Sept. 2013 and average performance during prime time starting in Oct. 2013. The average is well below the peak performance due to many factors including the variety of encodes we use to deliver the TV shows and movies we carry as well as home Wi-Fi and the variety of devices our members use. Those factors cancel out when comparing across ISPs, so these relative rankings are a good indicator of the consistent performance typically experienced across all users on an ISP network.
Something that's interesting about this data is that it measures speed end-to-end. So if you are an ISP that gives out flaky WiFi routers, your score will be lower not because of any limit between YouTube and the ISP or the ISP and the CPE, but because of that "last meter"* between the access point and laptop.
Is FiOS still giving out those terrible Actiontec routers? If so, maybe this will get them to fix that.
I still remember switching from them to Comcast to what should have been a far better connection (over 2x download and maybe 8x upload) and thinking it was crap... until I turned off the access point in the Actiontec and started using my old AP again.
I'm in Cambridge MA and got no results, so you're right, it must be quite localized.
UPDATE: Opening the page in incognito mode, I got results. My privacy settings prevented the tool from working. And those same settings are probably preventing YouTube from working well for me.
The graph in the actually video report is a poor way of representing that information IMO. It took me a second to figure out what the graph represented and then after that I still didn't know why I should care.
I guess average speed/bandwith was too esoteric to chart? #sarcasm
And the average user will never see it. If Google really wants to do something effective, add a red warning bar at the top of the page that says "Your ISP is making YouTube slower. Call them at...". I guarantee ISPs will take notice then.
If you're watching a video and your connection becomes slow, it prompts you to take a look at the report to understand what's making it slow.
It's not a direct phone number, but a reasonable number of average people will hopefully take a look while their video is buffering and start to understand that their ISP may be the reason YouTube seems slow.
I'm sure Google's efforts to shame ISPs with this new report are well-intentioned, but I really miss the old YouTube speedtest which it seemed almost nobody knew about: http://www.youtube.com/my_speed/
It seemed to show more data – both throughput from your actual cookied sessions and graphs of comparable connections around you. It took months for YouTube/Google to generate these reports when there was existing data out there already. I guess they wanted something that'd be easily digestible for a Netflix-style monthly shame-a-thon.
More companies should be keeping track of this, so in case we don't pass a strong net neutrality law, and ISP's do in fact start slowing everyone down in order to make them pay to get back to normal speeds [1], we can have a swift and strong backlash against them. Let's make it impossible for them to do this without millions of people finding out about it at once.
what happens if the big content providers pay the small (to them) amounts of money being asked?
if end users don't see a change in their content's speed - or if it comes FASTER because other data is being penalized, the problem is magnified. average joe says 'hey the internet has gotten much faster since they ended that pesky regulation' - and doesn't see the 30 media startups that couldn't get off the ground, because for them, the money asked to provide faster access is very pricey.
a startup average joe hasn't heard of won't have the money to outbid their competitors for the limited 'media bandwidth' the isp is willing to send through. average joe doesn't care about a company he hasn't heard of because he doesn't know what they have to offer.
my guess is that's what the ISP's want. they give the users a better experience - prioritizing video packets over email, for example, at no perceived cost to them. in doing so, they set up a huge barrier to entry that takes a long time for average joe to understand. he won't take the time to understand this, because the harm caused is a huge loss on possible new things in exchange for a small benefit to existing things.
Interesting. Given all of the complaints about the big providers, the chart suggests to me that they're doing an OK job? Perhaps Google is trying to get out in front of the arrival of throttling?
Also, as a cynical person, I compared SF to Washington DC expecting to see that DC was perfect and SF was not. Instead they looked quite comparable. In fact, I couldn't really find any major metro in which cable performed poorly (NYC wasn't wonderful).
I feel some of these results may be misleading. I watch YouTube mostly through Wifi, where the Wifi is the bottleneck and and not my ISP. The methodology page [1] doesn't seem to take that into account.
Well they are showing only ability to maintain a HD stream, not absolute speed. Any decent wifi network should be able to get at least 10mbit, so it won't impact HD streaming.
The visual storytelling of the associated video https://www.youtube.com/watch?v=XH863XXRZEQ is fantastic. You can watch the vid w/out sound and still understand the point they're trying to make.
Would a cable company, ISP for most of us, want to offer connections capable of ultra HD quality video streaming? Streaming threatens half of their business.
Same here. I am in San Francisco (Sonic.net) and I cannot see the graph shown in the article for San Francisco. Is there any way to ask for results for a specific location?
It doesn't have to be a big deal - maybe just a "cellphone bars"-like icon, linked to further info and net neutrality content.